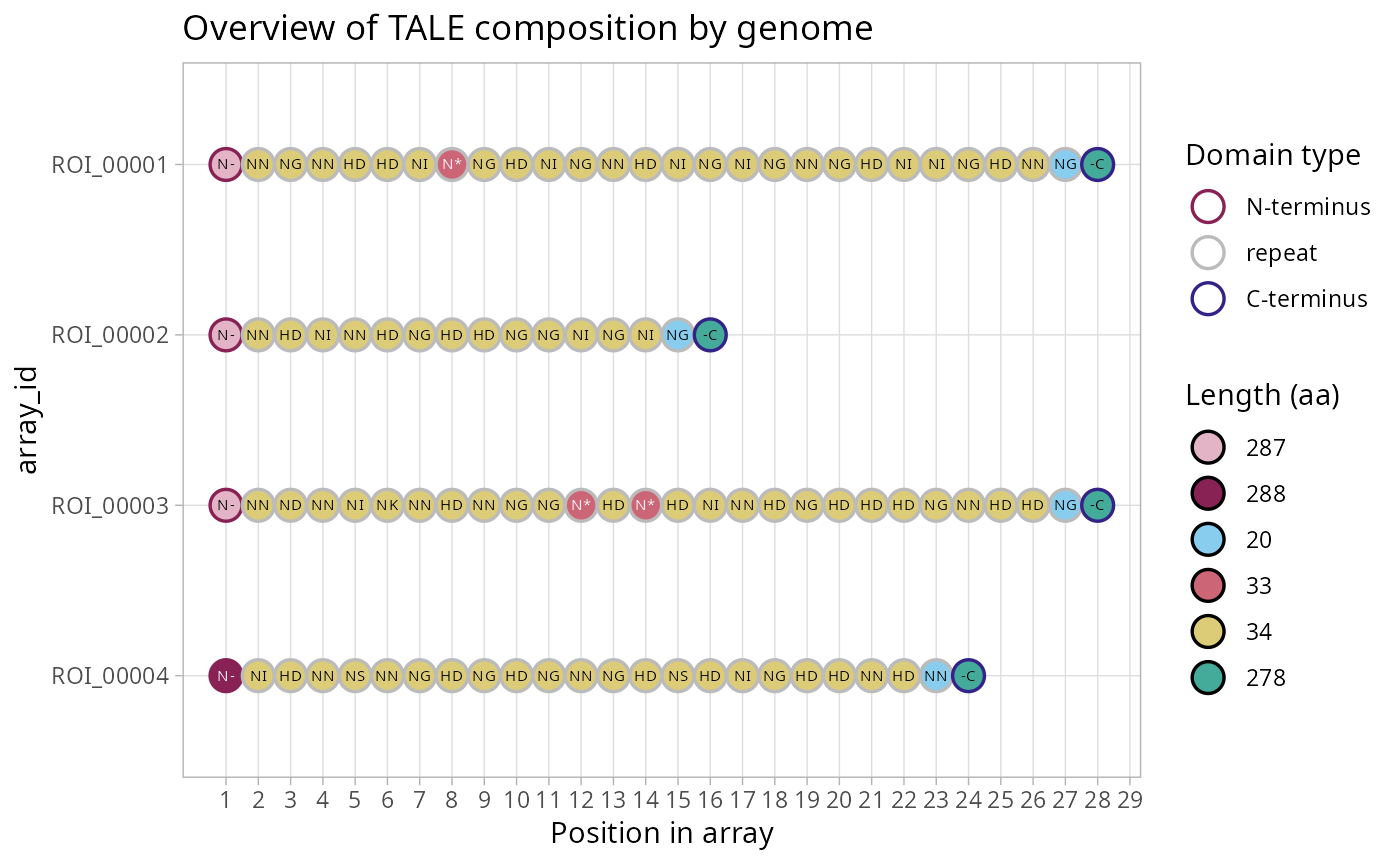
A compact, information-rich view of the arrays in a tales object: one
point per part, positioned by its place in the array, outlined by domain
type and filled by part type and amino-acid length. Each repeat carries
its RVD, each terminus the short name of its code (N-, -C,
or ?? for a terminus that does not match its TALE domain profile; see
tales_anchor_codes). Arrays are listed from the top in
alphabetical order of array_id.
The fill colours follow the role of each part. The canonical 34-aa repeat and the 20-aa half-repeat that ends every array get calm colours, so a repeat of any other length (an aberrant repeat, for instance) stands out. N-termini are shades of wine and C-termini shades of teal, lighter when shorter, which makes a truncated terminus visible. The legend gives the length of each colour, its keys outlined like the parts they stand for. All colours are chosen to stay distinct for colour-blind readers.
A tales_msa dispatches to plot.tales_msa
instead, being the more specific class.
Arguments
- x
A
talesobject, as returned bytales_from_telltalesor in thetaleselement oftales_compare_distal's output. A data frame of parts is accepted and converted withtales.- position
Which coordinate to lay the parts out on.
"array"(default) usesposition_in_array, so each array starts at 1 and runs contiguously."alignment"usesalignment_position, which requires an aligned object (or one demoted from atales_msa, which keeps the column): gaps then appear as empty columns and shared features line up. Aberrant repeats, for instance, are visible as a column in the aligned layout and scattered in the unaligned one.- facet_by
Names of the columns whose values split the plot into panels, stacked in rows whose height follows the number of arrays. Each column must hold one value per array:
"seqnames"(the default, one panel per source sequence) or"strain"for a set of genomes, for instance, andc("strain", "seqnames")for both.NULLdraws a single panel, as does the default whenxhas noseqnamescolumn.- ...
Unused, present for compatibility with the
plotgeneric.
Value
A ggplot object. Like any ggplot, it is drawn when printed, which
happens automatically at the console; inside a loop or a function, call
print() on it.
See also
Other TALE plots:
plot.tales_msa(),
plot_target_preds(),
talomes_heatmap()
Examples
x <- tales_from_telltales(system.file("extdata", "tellTaleExampleOutput",
package = "tantale"))
plot(x)
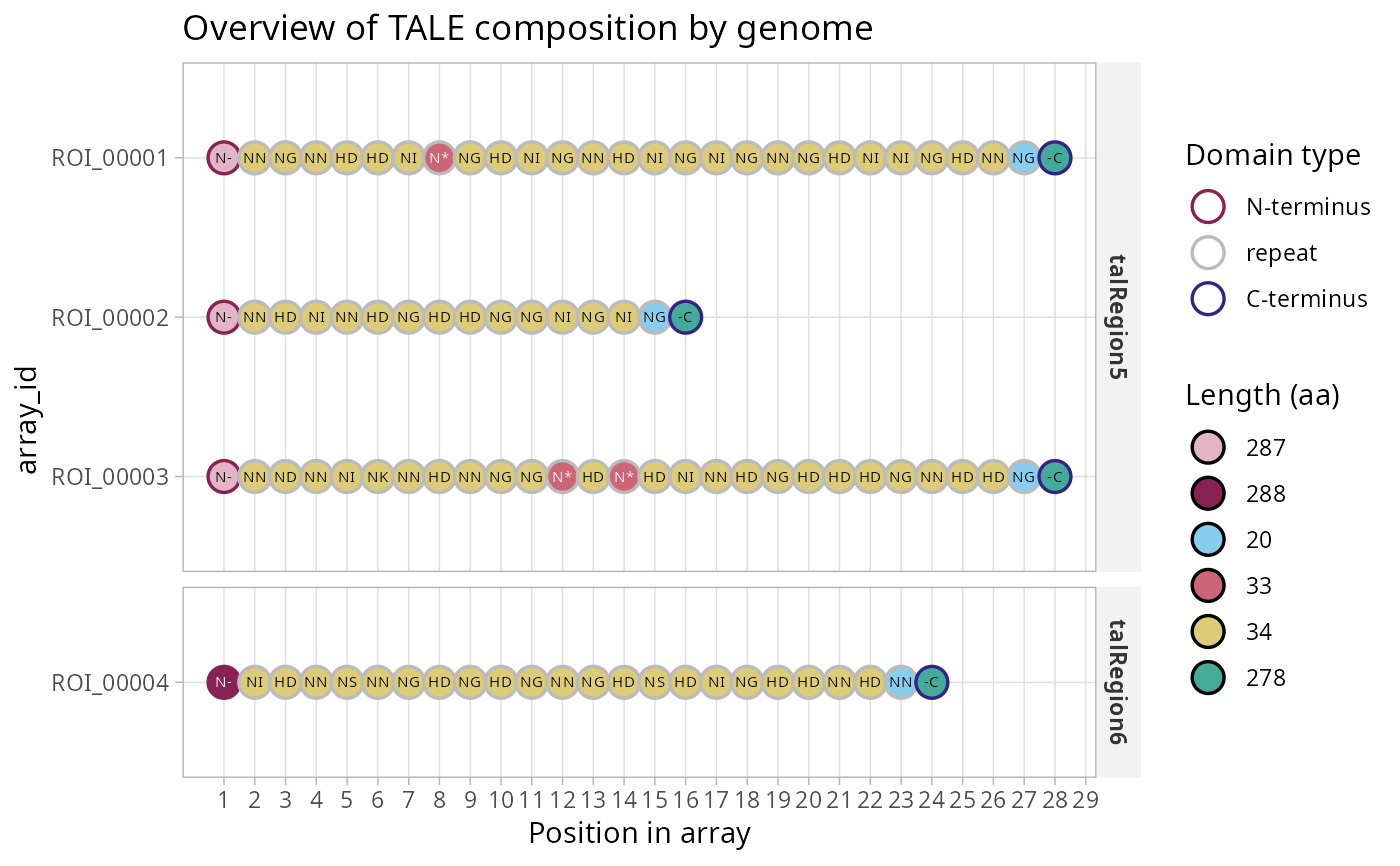 plot(x, facet_by = NULL)