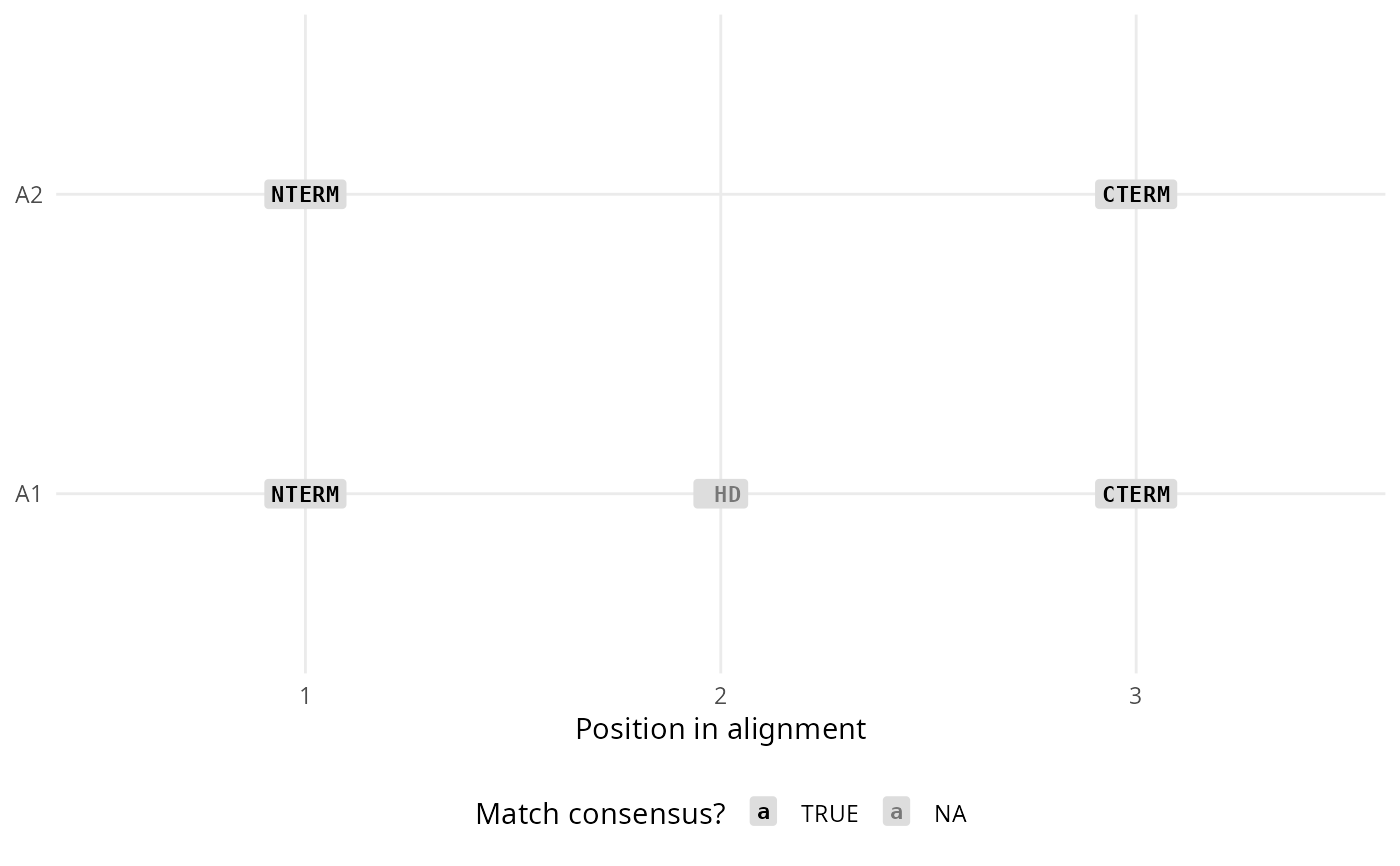
Draws the alignment as a heatmap: one row per array, one column per alignment position, with cells coloured by one layer and optionally labelled with another.
Usage
# S3 method for class 'tales_msa'
plot(
  x,
  fill = NULL,
  label = NULL,
  tale_distances = NULL,
  domain_distances = NULL,
  h_cut = 10,
  ref_pattern = NULL,
  consensus = FALSE,
  fill_type = "domain_clust",
  ...
)
Arguments
- x
A
tales_msaobject.- fill
Layer whose values colour the cells. Defaults to
"dom_code"when present, otherwise the first available residue layer.- label
Layer whose values are written in the cells. Left unset it defaults to
"rvd"when that is not already thefill; passNULLexplicitly for an unlabelled heatmap.- tale_distances
Pairwise distances between whole TALEs, as the
tale_distanceselement of atales_compare_distalresult. Used to build the tree panel that orders the alignment rows.- domain_distances
Pairwise distances between distinct domains, as the
domain_distanceselement of atales_compare_distalresult. Used to group domains into clusters, and to score each domain against the reference TALE\'s domain at the same alignment column.- h_cut
Height at which the domain tree is cut to define clusters. Interpreted on a distance scale, so 0 means identical.
- ref_pattern
Regular expression matched against the array names to choose the reference TALE. Must identify exactly one.
- consensus
Whether to add a consensus panel above the alignment. The consensus is the most frequent element in each column of the labelled layer, so it always matches what the cells say.
- fill_type
One of
"domain_clust","domain_sim"or"rvd_sim". The first two colour cells by domain cluster or by protein-sequence similarity to the reference, for every distinct part, termini included (see Details)."rvd_sim"colours them instead by how alike each RVD's DNA-binding preference is to the reference TALE's RVD at that position, on a diverging scale over[-1, 1]. The domain- and RVD-level views genuinely differ: repeats carryingHDandNDdiffer in sequence yet both favour cytosine, while repeats differing only at positions 12-13 are near-identical proteins targeting different bases.- ...
Unused, present for compatibility with the
plotgeneric.
Value
The alignment plot, returned invisibly after being printed as a
side effect: a ggplot normally, or, when tale_distances
and/or consensus add extra panels, an
aplot composition – see Details.
Details
A tales_msa carries every layer at once (rvd,
dom_code and whatever else the object holds), so fill and
label simply name two of them.
Three settings act independently, and it helps to read the figure that way: what each cell says, what colour that text is, and what colour the block behind it is.
Cell text is whatever label names, or nothing when
label = NULL. Termini are relabelled N- and -C; an
unidentified terminus keeps its XXXXX code.
Domain codes are padded to three characters so columns line up.
Text colour always answers one question: does this element match
the consensus of its column? Black for yes, red for no, grey where the
column has no consensus (a gap, or a tie). The block fills are all pale,
so the text reads on every one of them. The consensus is the most
frequent element in the column (tales_consensus), taken over
the labelled layer, so the text colour and the text itself always describe
the same thing.
Block fill is what fill_type selects, and it is the only
part that can be unavailable:
| fill_type | shows | needs |
"domain_clust" | which cluster the domain falls in, cut at h_cut | domain_distances |
"domain_sim" | protein-sequence similarity to the reference, 0-100 | domain_distances |
"rvd_sim" | how alike the RVD's DNA-binding preference is to the reference's, -1 to 1 | a label layer |
Every value here scores across the whole tales_msa, termini
included: domain_distances covers every distinct part sequence,
and "domain_clust"/"domain_sim" colour a terminus cell
exactly like a repeat cell.
With no domain_distances and no label, every block is flat
grey: the text still carries the consensus comparison, but there is
nothing to colour blocks by.
A cell with no value for the chosen layer keeps its text and is filled
grey. In "rvd_sim" that is the termini, which have no DNA-binding
preference and so no position on a specificity scale. The RVD similarity
table is TALVEZ's and covers 17 RVDs; a rarer RVD (NV, say) scores
1 where it is identical to the reference's RVD and is grey elsewhere.
The reference matters for both similarity fills.
ref_pattern must match exactly one array name; otherwise the
function warns and uses the default, which is the array with the most
non-gap parts, ties broken alphabetically. The reference row is marked
with a trailing _#.
Two panels may be attached. Supplying tale_distances with
more than one array adds a dendrogram panel on the left; consensus =
TRUE adds a consensus panel on top. When either is present the return
value is an aplot composition: modify the alignment through its
plotlist element, since layers added to the composition itself do
not reach it.
See also
Other TALE plots:
plot.tales(),
plot_target_preds(),
talomes_heatmap()